Many beginners will initially rely on the train-test method to evaluate their models. This method is straightforward and seems to give a clear indication of how well a model performs on unseen data. However, this approach can often lead to an incomplete understanding of a model’s capabilities. In this blog, we’ll discuss why it’s important to go beyond the basic train-test split and how cross-validation can offer a more thorough evaluation of model performance. Join us as we guide you through the essential steps to achieve a deeper and more accurate assessment of your machine learning models.
Let’s get started.
From Train-Test to Cross-Validation: Advancing Your Model’s Evaluation
Photo by Belinda Fewings. Some rights reserved.
Overview
This post is divided into three parts; they are:
- Model Evaluation: Train-Test vs. Cross-Validation
- The “Why” of Cross-Validation
- Delving Deeper with K-Fold Cross-Validation
Model Evaluation: Train-Test vs. Cross-Validation
A machine learning model is determined by its design (such as a linear vs. non-linear model) and its parameters (such as the coefficients in a linear regression model). You need to make sure the model is suitable for the data before considering how to fit the model.
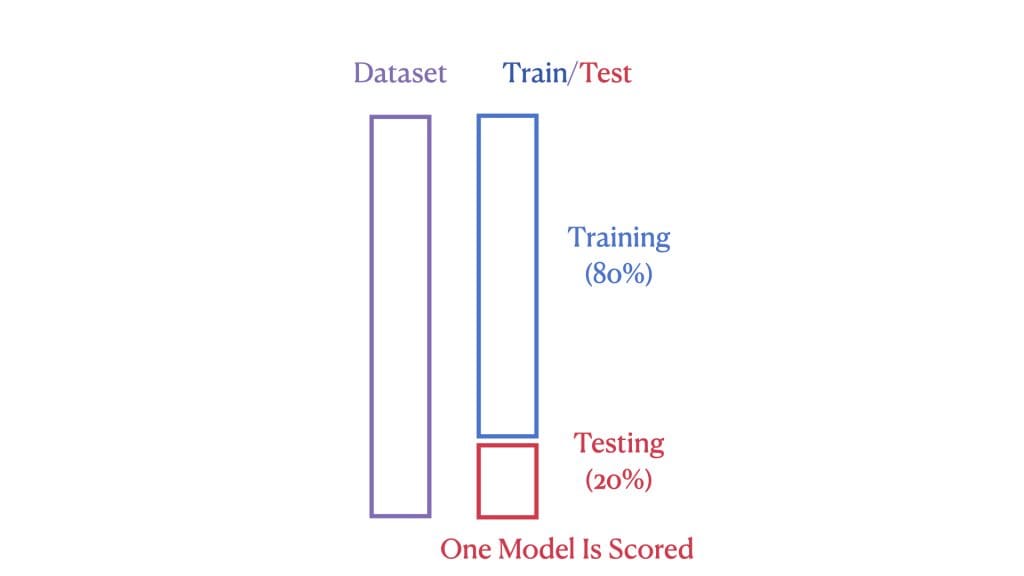
The performance of a machine learning model is gauged by how well it performs on previously unseen (or test) data. In a standard train-test split, we divide the dataset into two parts: a larger portion for training our model and a smaller portion for testing its performance. The model is suitable if the tested performance is acceptable. This approach is straightforward but doesn’t always utilize our data most effectively.
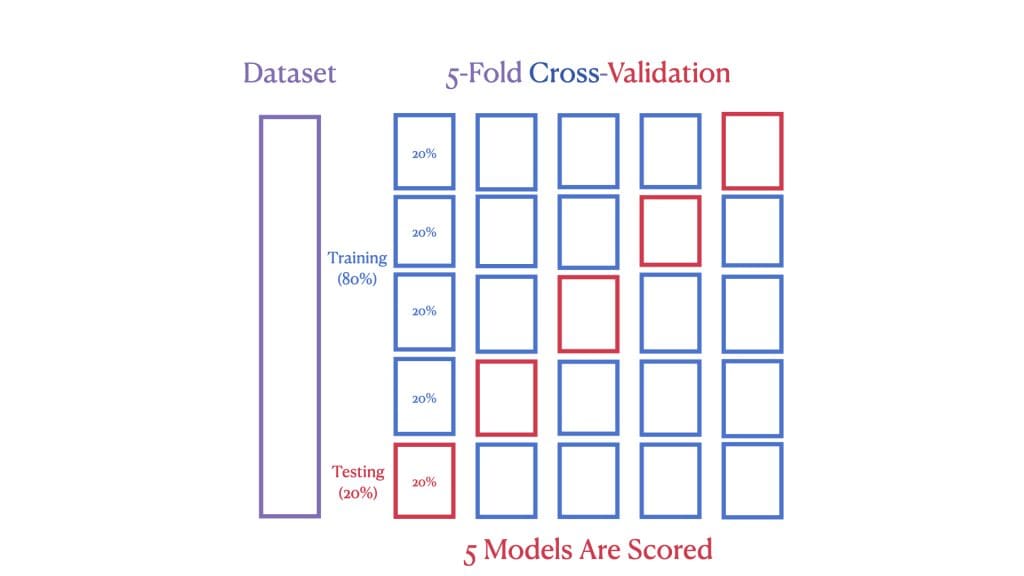
However, with cross-validation, we go a step further. The second image shows a 5-Fold Cross-Validation, where the dataset is split into five “folds.” In each round of validation, a different fold is used as the test set while the remaining form the training set. This process is repeated five times, ensuring each data point is used for training and testing.
Here is an example to illustrate the above:
|
1 2 3 4 5 6 7 8 9 10 11 12 13 14 15 16 17 18 19 20 21 22 23 24 25 |
# Load the Ames dataset import pandas as pd Ames = pd.read_csv(‘Ames.csv’)
# Import Linear Regression, Train-Test, Cross-Validation from scikit-learn from sklearn.linear_model import LinearRegression from sklearn.model_selection import train_test_split, cross_val_score
# Select features and target X = Ames[[‘GrLivArea’]] # Feature: GrLivArea, a 2D matrix y = Ames[‘SalePrice’] # Target: SalePrice, a 1D vector
# Split data into training and testing sets X_train, X_test, y_train, y_test = train_test_split(X, y, test_size=0.2, random_state=42)
# Linear Regression model using Train-Test model = LinearRegression() model.fit(X_train, y_train) train_test_score = round(model.score(X_test, y_test), 4) print(f“Train-Test R^2 Score: {train_test_score}”)
# Perform 5-Fold Cross-Validation cv_scores = cross_val_score(model, X, y, cv=5) cv_scores_rounded = [round(score, 4) for score in cv_scores] print(f“Cross-Validation R^2 Scores: {cv_scores_rounded}”) |
While the train-test method yields a single R² score, cross-validation provides us with a spectrum of five different R² scores, one from each fold of the data, offering a more comprehensive view of the model’s performance:
|
Train-Test R^2 Score: 0.4789 Cross-Validation R^2 Scores: [0.4884, 0.5412, 0.5214, 0.5454, 0.4673] |
The roughly equal R² scores among the five means the model is stable. You can then decide whether this model (i.e., linear regression) provides an acceptable prediction power.
The “Why” of Cross-Validation
Understanding the variability of our model’s performance across different subsets of data is crucial in machine learning. The train-test split method, while useful, only gives us a snapshot of how our model might perform on one particular set of unseen data.
Cross-validation, by systematically using multiple folds of data for both training and testing, offers a more robust and comprehensive evaluation of the model’s performance. Each fold acts as an independent test, providing insights into how the model is expected to perform across varied data samples. This multiplicity not only helps identify potential overfitting but also ensures that the performance metric (in this case, R² score) is not overly optimistic or pessimistic, but rather a more reliable indicator of how the model will generalize to unseen data.
To visually demonstrate this, let’s consider the R² scores from both a train-test split and a 5-fold cross-validation process:
|
1 2 3 4 5 6 7 8 9 10 11 12 13 14 15 16 17 18 19 20 21 |
# Import Seaborn and Matplotlib import seaborn as sns import matplotlib.pyplot as plt
# Assuming cv_scores_rounded contains your cross-validation scores # And train_test_score is your single train-test R^2 score
# Plot the box plot for cross-validation scores cv_scores_df = pd.DataFrame(cv_scores_rounded, columns=[‘Cross-Validation Scores’]) sns.boxplot(data=cv_scores_df, y=‘Cross-Validation Scores’, width=0.3, color=‘lightblue’, fliersize=0)
# Overlay individual scores as points plt.scatter([0] * len(cv_scores_rounded), cv_scores_rounded, color=‘blue’, label=‘Cross-Validation Scores’) plt.scatter(0, train_test_score, color=‘red’, zorder=5, label=‘Train-Test Score’)
# Plot the visual plt.title(‘Model Evaluation: Cross-Validation vs. Train-Test’) plt.ylabel(‘R^2 Score’) plt.xticks([0], [‘Evaluation Scores’]) plt.legend(loc=‘lower left’, bbox_to_anchor=(0, +0.1)) plt.show() |
This visualization underscores the difference in insights gained from a single train-test evaluation versus the broader perspective offered by cross-validation:
Through cross-validation, we gain a deeper understanding of our model’s performance, moving us closer to developing machine learning solutions that are both effective and reliable.
Delving Deeper with K-Fold Cross-Validation
Cross-validation is a cornerstone of reliable machine learning model evaluation, with cross_val_score() providing a quick and automated way to perform this task. Now, we turn our attention to the KFold class, a component of scikit-learn that offers a deeper dive into the folds of cross-validation. The KFold class provides not just a score but a window into the model’s performance across different segments of our data. We demonstrate this by replicating the example above:
|
1 2 3 4 5 6 7 8 9 10 11 12 13 14 15 16 17 18 19 20 21 22 23 24 25 26 27 28 |
# Import K-Fold and necessary libraries from sklearn.model_selection import KFold from sklearn.linear_model import LinearRegression from sklearn.metrics import r2_score
# Select features and target X = Ames[[‘GrLivArea’]].values # Convert to numpy array for KFold y = Ames[‘SalePrice’].values # Convert to numpy array for KFold
# Initialize Linear Regression and K-Fold model = LinearRegression() kf = KFold(n_splits=5)
# Manually perform K-Fold Cross-Validation for fold, (train_index, test_index) in enumerate(kf.split(X), start=1): # Split the data into training and testing sets X_train, X_test = X[train_index], X[test_index] y_train, y_test = y[train_index], y[test_index]
# Fit the model and predict model.fit(X_train, y_train) y_pred = model.predict(X_test)
# Calculate and print the R^2 score for the current fold print(f“Fold {fold}:”) print(f“TRAIN set size: {len(train_index)}”) print(f“TEST set size: {len(test_index)}”) print(f“R^2 score: {round(r2_score(y_test, y_pred), 4)}n”) |
This code block will show us the size of each training and testing set and the corresponding R² score for each fold:
|
1 2 3 4 5 6 7 8 9 10 11 12 13 14 15 16 17 18 19 20 21 22 23 24 |
Fold 1: TRAIN set size: 2063 TEST set size: 516 R^2 score: 0.4884
Fold 2: TRAIN set size: 2063 TEST set size: 516 R^2 score: 0.5412
Fold 3: TRAIN set size: 2063 TEST set size: 516 R^2 score: 0.5214
Fold 4: TRAIN set size: 2063 TEST set size: 516 R^2 score: 0.5454
Fold 5: TRAIN set size: 2064 TEST set size: 515 R^2 score: 0.4673 |
The KFold class shines in its transparency and control over the cross-validation process. While cross_val_score() simplifies the process into one line, KFold opens it up, allowing us to view the exact splits of our data. This is incredibly valuable when you need to:
- Understand how your data is being divided.
- Implement custom preprocessing before each fold.
- Gain insights into the consistency of your model’s performance.
By using the KFold class, you can manually iterate over each split and apply the model training and testing process. This not only helps in ensuring that you’re fully informed about the data being used at each stage but also offers the opportunity to modify the process to suit complex needs.
Further Reading
APIs
Tutorials
Ames Housing Dataset & Data Dictionary
Summary
In this post, we explored the importance of thorough model evaluation through cross-validation and the KFold method. Both techniques meticulously avoid the pitfall of data leakage by keeping training and testing data distinct, thereby ensuring the model’s performance is accurately measured. Moreover, by validating each data point exactly once and using it for training K-1 times, these methods provide a detailed view of the model’s ability to generalize, boosting confidence in its real-world applicability. Through practical examples, we’ve demonstrated how integrating these strategies into your evaluation process leads to more reliable and robust machine learning models, ready for the challenges of new and unseen data.
Specifically, you learned:
- The efficiency of
cross_val_score()in automating the cross-validation process. - How
KFoldoffers detailed control over data splits for tailored model evaluation. - How both methods ensure full data utilization and prevent data leakage.
Do you have any questions? Please ask your questions in the comments below, and I will do my best to answer.


